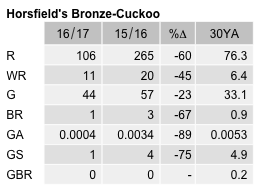
Horsfield’s Bronze-Cuckoo
Chalcites basalis
ABR description
The following is extracted from the Annual Bird Report for the twelve months to June 2017.
Common, Breeding summer migrant
Occurs in open forest mainly in spring and summer.
General: 110 records down from 265 last year from 46 grids down from 57 grids last year. Abundance is down 72% on last year and down 74% on the 30YA. The reporting rate is down 66% on last year and down 72% on the 30YA, the second lowest rate after 2004. Observed almost exclusively in spring 37% and summer 58%. Earliest 1/13 Aug Michelago GrL25 (LaS2); latest, 1/8 Apr Yass Gorge GrFo3 (SeB1). 1 breeding record: di/14 Oct Bibaringa GrH14 (SmA1).
GBS: 1 record this year, down from 10 last year: 1/2wk Nov Carwoola GrQ16 (BuM1).
Abundance
Abundance is the average number of birds of that species per survey. Where the species was observed (presence recorded) but the number of birds seen was not recorded, this is treated as a count of zero.
Abundance by year
This chart shows the abundance of Horsfield’s Bronze-Cuckoo between 1982 and 2017. 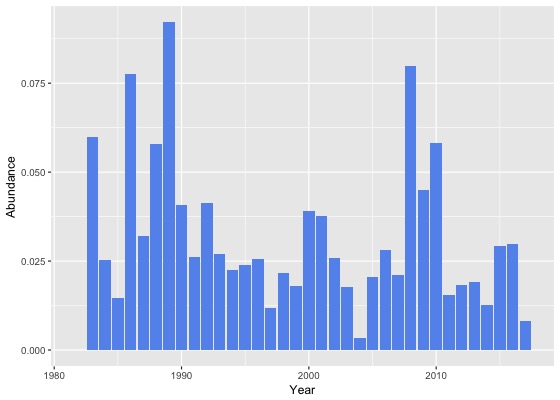
Abundance by month
This chart shows the monthly abundance of Horsfield’s Bronze-Cuckoo. The blue lines show the abundance for the twelve months to June 2017 and the bars show the average abundance for the period 1982 to 2017. 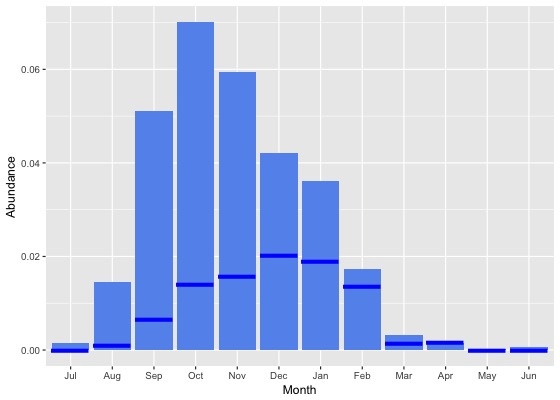
Abundance by season
This chart shows the seasonal abundance of Horsfield’s Bronze-Cuckoo. The blue lines show the seasonal abundance for the twelve months to June 2017 and the bars show the average seasonal abundance for the period 1982 to 2017. 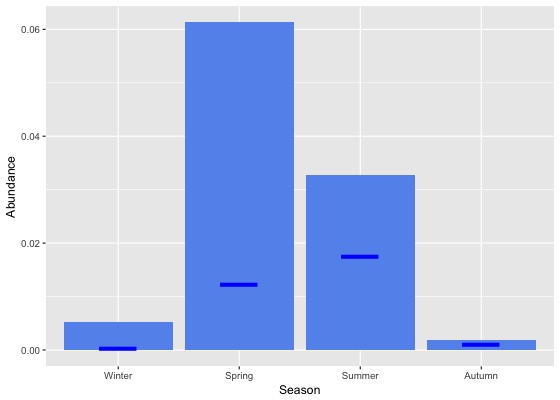
Abundance data
| Month | Season | ||||||||||||||||||
|---|---|---|---|---|---|---|---|---|---|---|---|---|---|---|---|---|---|---|---|
| Period | Jul | Aug | Sep | Oct | Nov | Dec | Jan | Feb | Mar | Apr | May | Jun | Winter | Spring | Summer | Autumn | All | ||
| All years | |||||||||||||||||||
| All | 0.0 | 0.0 | 0.1 | 0.1 | 0.1 | 0.0 | 0.0 | 0.0 | 0.0 | 0.0 | 0.0 | 0.0 | 0.0 | 0.1 | 0.0 | 0.0 | 0.0 | ||
| Previous years | |||||||||||||||||||
| All previous years | 0.0 | 0.0 | 0.1 | 0.1 | 0.1 | 0.0 | 0.0 | 0.0 | 0.0 | 0.0 | 0.0 | 0.0 | 0.0 | 0.1 | 0.0 | 0.0 | 0.0 | ||
| Previous 30 years | 0.0 | 0.0 | 0.1 | 0.1 | 0.1 | 0.0 | 0.0 | 0.0 | 0.0 | 0.0 | 0.0 | 0.0 | 0.0 | 0.1 | 0.0 | 0.0 | 0.0 | ||
| Previous 20 years | 0.0 | 0.0 | 0.1 | 0.1 | 0.1 | 0.0 | 0.0 | 0.0 | 0.0 | 0.0 | 0.0 | 0.0 | 0.0 | 0.1 | 0.0 | 0.0 | 0.0 | ||
| 10 year groups | |||||||||||||||||||
| [2007,2017) | 0.0 | 0.0 | 0.1 | 0.1 | 0.1 | 0.0 | 0.0 | 0.0 | 0.0 | 0.0 | 0.0 | 0.0 | 0.0 | 0.1 | 0.0 | 0.0 | 0.0 | ||
| [1997,2007) | 0.0 | 0.0 | 0.1 | 0.1 | 0.0 | 0.0 | 0.0 | 0.0 | 0.0 | 0.0 | 0.0 | 0.0 | 0.0 | 0.1 | 0.0 | 0.0 | 0.0 | ||
| [1987,1997) | 0.0 | 0.0 | 0.1 | 0.1 | 0.1 | 0.1 | 0.1 | 0.0 | 0.0 | 0.0 | 0.0 | 0.0 | 0.0 | 0.1 | 0.1 | 0.0 | 0.0 | ||
| 5 year groups | |||||||||||||||||||
| [2012,2017) | 0.0 | 0.0 | 0.0 | 0.1 | 0.1 | 0.0 | 0.0 | 0.0 | 0.0 | 0.0 | 0.0 | 0.0 | 0.0 | 0.1 | 0.0 | 0.0 | 0.0 | ||
| [2007,2012) | 0.0 | 0.0 | 0.1 | 0.1 | 0.1 | 0.0 | 0.0 | 0.0 | 0.0 | 0.0 | 0.0 | 0.0 | 0.0 | 0.1 | 0.0 | 0.0 | 0.0 | ||
| [2002,2007) | 0.0 | 0.0 | 0.0 | 0.1 | 0.0 | 0.0 | 0.0 | 0.0 | 0.0 | 0.0 | 0.0 | 0.0 | 0.0 | 0.0 | 0.0 | 0.0 | 0.0 | ||
| [1997,2002) | 0.0 | 0.0 | 0.1 | 0.1 | 0.0 | 0.0 | 0.0 | 0.0 | 0.0 | 0.0 | 0.0 | 0.0 | 0.0 | 0.1 | 0.0 | 0.0 | 0.0 | ||
| [1992,1997) | 0.0 | 0.0 | 0.1 | 0.1 | 0.1 | 0.0 | 0.0 | 0.0 | 0.0 | 0.0 | 0.0 | 0.0 | 0.0 | 0.1 | 0.0 | 0.0 | 0.0 | ||
| [1987,1992) | 0.0 | 0.0 | 0.1 | 0.1 | 0.1 | 0.1 | 0.1 | 0.0 | 0.0 | 0.0 | 0.0 | 0.0 | 0.0 | 0.1 | 0.1 | 0.0 | 0.1 | ||
| Year | |||||||||||||||||||
| 2017 | 0.0 | 0.0 | 0.0 | 0.0 | 0.0 | 0.0 | 0.0 | 0.0 | 0.0 | 0.0 | 0.0 | 0.0 | 0.0 | 0.0 | 0.0 | 0.0 | 0.0 | ||
| 2016 | 0.0 | 0.0 | 0.0 | 0.1 | 0.1 | 0.1 | 0.0 | 0.0 | 0.0 | 0.0 | 0.0 | 0.0 | 0.0 | 0.1 | 0.0 | 0.0 | 0.0 | ||
| 2015 | 0.0 | 0.0 | 0.0 | 0.1 | 0.1 | 0.1 | 0.1 | 0.0 | 0.0 | 0.0 | 0.0 | 0.0 | 0.0 | 0.1 | 0.1 | 0.0 | 0.0 | ||
| 2014 | 0.0 | 0.0 | 0.0 | 0.0 | 0.0 | 0.0 | 0.0 | 0.0 | 0.0 | 0.0 | 0.0 | 0.0 | 0.0 | 0.0 | 0.0 | 0.0 | 0.0 | ||
| 2013 | 0.0 | 0.0 | 0.0 | 0.1 | 0.0 | 0.0 | 0.0 | 0.0 | 0.0 | 0.0 | 0.0 | 0.0 | 0.0 | 0.0 | 0.0 | 0.0 | 0.0 | ||
| 2012 | 0.0 | 0.0 | 0.0 | 0.0 | 0.1 | 0.0 | 0.0 | 0.0 | 0.0 | 0.0 | 0.0 | 0.0 | 0.0 | 0.0 | 0.0 | 0.0 | 0.0 | ||
| 2011 | 0.0 | 0.0 | 0.0 | 0.0 | 0.0 | 0.0 | 0.0 | 0.0 | 0.0 | 0.0 | 0.0 | 0.0 | 0.0 | 0.0 | 0.0 | 0.0 | 0.0 | ||
| 2010 | 0.0 | 0.1 | 0.2 | 0.1 | 0.1 | 0.0 | 0.0 | 0.0 | 0.0 | 0.0 | 0.0 | 0.0 | 0.0 | 0.1 | 0.0 | 0.0 | 0.1 | ||
| 2009 | 0.0 | 0.0 | 0.1 | 0.1 | 0.1 | 0.0 | 0.0 | 0.0 | 0.0 | 0.0 | 0.0 | 0.0 | 0.0 | 0.1 | 0.0 | 0.0 | 0.0 | ||
| 2008 | 0.0 | 0.1 | 0.2 | 0.1 | 0.1 | 0.1 | 0.1 | 0.1 | 0.0 | 0.0 | 0.0 | 0.0 | 0.0 | 0.2 | 0.1 | 0.0 | 0.1 | ||
| 2007 | 0.0 | 0.0 | 0.0 | 0.1 | 0.0 | 0.0 | 0.0 | 0.0 | 0.0 | 0.0 | 0.0 | 0.0 | 0.0 | 0.1 | 0.0 | 0.0 | 0.0 | ||
| 2006 | 0.0 | 0.0 | 0.0 | 0.1 | 0.0 | 0.1 | 0.0 | 0.0 | 0.0 | 0.0 | 0.0 | 0.0 | 0.0 | 0.1 | 0.0 | 0.0 | 0.0 | ||
| 2005 | 0.0 | 0.0 | 0.0 | 0.0 | 0.1 | 0.0 | 0.0 | 0.0 | 0.0 | 0.0 | 0.0 | 0.0 | 0.0 | 0.0 | 0.0 | 0.0 | 0.0 | ||
| 2004 | 0.0 | 0.0 | 0.0 | 0.0 | 0.0 | 0.0 | 0.0 | 0.0 | 0.0 | 0.0 | 0.0 | 0.0 | 0.0 | 0.0 | 0.0 | 0.0 | 0.0 | ||
| 2003 | 0.0 | 0.0 | 0.0 | 0.1 | 0.1 | 0.0 | 0.0 | 0.0 | 0.0 | 0.0 | 0.0 | 0.0 | 0.0 | 0.0 | 0.0 | 0.0 | 0.0 | ||
| 2002 | 0.0 | 0.0 | 0.1 | 0.1 | 0.0 | 0.0 | 0.0 | 0.0 | 0.0 | 0.0 | 0.0 | 0.0 | 0.0 | 0.1 | 0.0 | 0.0 | 0.0 | ||
| 2001 | 0.0 | 0.0 | 0.1 | 0.1 | 0.1 | 0.1 | 0.0 | 0.0 | 0.0 | 0.0 | 0.0 | 0.0 | 0.0 | 0.1 | 0.1 | 0.0 | 0.0 | ||
| 2000 | 0.0 | 0.1 | 0.1 | 0.1 | 0.1 | 0.0 | 0.0 | 0.0 | 0.0 | 0.0 | 0.0 | 0.0 | 0.0 | 0.1 | 0.0 | 0.0 | 0.0 | ||
| 1999 | 0.0 | 0.0 | 0.1 | 0.0 | 0.0 | 0.0 | 0.0 | 0.0 | 0.0 | 0.0 | 0.0 | 0.0 | 0.0 | 0.0 | 0.0 | 0.0 | 0.0 | ||
| 1998 | 0.0 | 0.0 | 0.1 | 0.0 | 0.0 | 0.0 | 0.0 | 0.0 | 0.0 | 0.0 | 0.0 | 0.0 | 0.0 | 0.1 | 0.0 | 0.0 | 0.0 | ||
| 1997 | 0.0 | 0.0 | 0.1 | 0.0 | 0.0 | 0.0 | 0.0 | 0.0 | 0.0 | 0.0 | 0.0 | 0.0 | 0.0 | 0.0 | 0.0 | 0.0 | 0.0 | ||
| 1996 | 0.0 | 0.0 | 0.1 | 0.1 | 0.0 | 0.0 | 0.0 | 0.0 | 0.0 | 0.0 | 0.0 | 0.0 | 0.0 | 0.1 | 0.0 | 0.0 | 0.0 | ||
| 1995 | 0.0 | 0.0 | 0.0 | 0.1 | 0.0 | 0.0 | 0.0 | 0.1 | 0.0 | 0.0 | 0.0 | 0.0 | 0.0 | 0.0 | 0.0 | 0.0 | 0.0 | ||
| 1994 | 0.0 | 0.0 | 0.0 | 0.1 | 0.0 | 0.0 | 0.0 | 0.0 | 0.0 | 0.0 | 0.0 | 0.0 | 0.0 | 0.0 | 0.0 | 0.0 | 0.0 | ||
| 1993 | 0.0 | 0.0 | 0.0 | 0.0 | 0.2 | 0.1 | 0.0 | 0.0 | 0.0 | 0.0 | 0.0 | 0.0 | 0.0 | 0.1 | 0.1 | 0.0 | 0.0 | ||
| 1992 | 0.0 | 0.0 | 0.1 | 0.1 | 0.1 | 0.1 | 0.0 | 0.0 | 0.0 | 0.0 | 0.0 | 0.0 | 0.0 | 0.1 | 0.0 | 0.0 | 0.0 | ||
| 1991 | 0.0 | 0.0 | 0.0 | 0.1 | 0.0 | 0.1 | 0.0 | 0.1 | 0.0 | 0.0 | 0.0 | 0.0 | 0.0 | 0.1 | 0.0 | 0.0 | 0.0 | ||
| 1990 | 0.0 | 0.0 | 0.1 | 0.1 | 0.1 | 0.1 | 0.1 | 0.0 | 0.0 | 0.0 | 0.0 | 0.0 | 0.0 | 0.1 | 0.1 | 0.0 | 0.0 | ||
| 1989 | 0.0 | 0.1 | 0.1 | 0.2 | 0.2 | 0.2 | 0.1 | 0.1 | 0.0 | 0.0 | 0.0 | 0.0 | 0.0 | 0.2 | 0.1 | 0.0 | 0.1 | ||
| 1988 | 0.0 | 0.0 | 0.1 | 0.1 | 0.1 | 0.1 | 0.1 | 0.1 | 0.0 | 0.0 | 0.0 | 0.0 | 0.0 | 0.1 | 0.1 | 0.0 | 0.1 | ||
| 1987 | 0.0 | 0.0 | 0.0 | 0.1 | 0.1 | 0.0 | 0.0 | 0.0 | 0.0 | 0.0 | 0.0 | 0.0 | 0.0 | 0.1 | 0.0 | 0.0 | 0.0 | ||
| 1986 | 0.0 | 0.0 | 0.1 | 0.2 | 0.2 | 0.1 | 0.0 | 0.0 | 0.0 | 0.0 | 0.0 | 0.0 | 0.0 | 0.2 | 0.1 | 0.0 | 0.1 | ||
| 1985 | 0.0 | 0.0 | 0.0 | 0.0 | 0.1 | 0.0 | 0.0 | 0.0 | 0.0 | 0.0 | 0.0 | 0.0 | 0.0 | 0.0 | 0.0 | 0.0 | 0.0 | ||
| 1984 | 0.0 | 0.0 | 0.0 | 0.0 | 0.0 | 0.0 | 0.1 | 0.1 | 0.0 | 0.0 | 0.0 | 0.0 | 0.0 | 0.0 | 0.1 | 0.0 | 0.0 | ||
| 1983 | 0.0 | 0.1 | 0.0 | 0.1 | 0.4 | 0.0 | 0.0 | 0.0 | 0.0 | - | 0.0 | 0.0 | 0.0 | 0.2 | 0.0 | 0.0 | 0.1 | ||
| 1982 | - | 0.0 | - | 0.0 | 0.0 | 0.0 | - | 0.0 | - | 0.0 | - | 0.0 | 0.0 | 0.0 | 0.0 | 0.0 | 0.0 | ||
Reporting rates
Reporting rate is the proportion of all surveys in which the species was present.
Reporting rate by year
This chart shows the reporting rate of Horsfield’s Bronze-Cuckoo each year between 1982 and 2017. 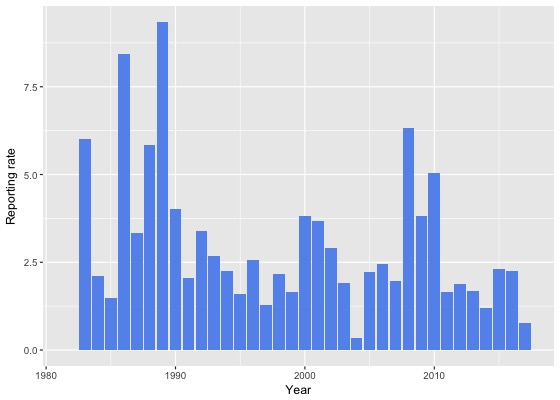
Reporting rate by month
This chart shows the reporting rate by month of Horsfield’s Bronze-Cuckoo. The blue lines show the reporting rate for the twelve months to June 2017 and the bars show the average reporting rate for the period 1982 to 2017. 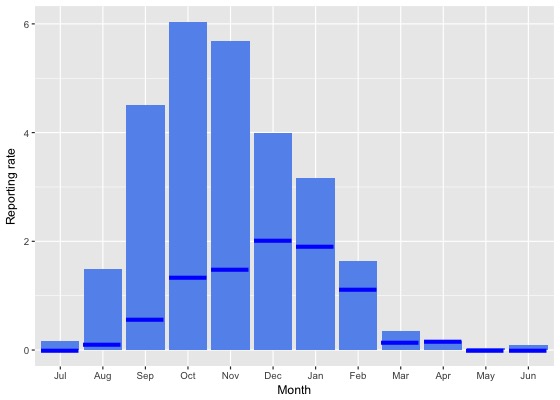
Reporting rate by season
This chart shows the seasonal reporting rate of Horsfield’s Bronze-Cuckoo. The blue lines show the seasonal reporting rate for the twelve months to June 2017 and the bars show the average seasonal reporting rate for the period 1982 to 2017. 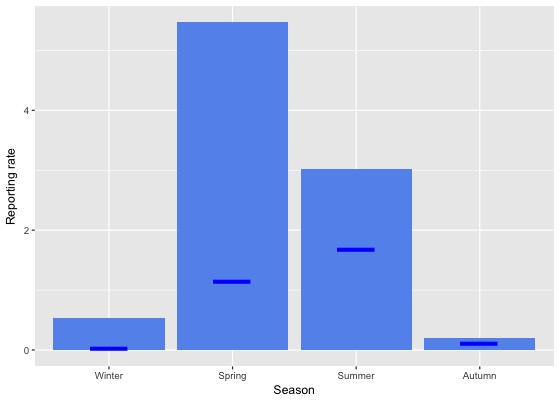
Reporting rate data
| Month | Season | ||||||||||||||||||
|---|---|---|---|---|---|---|---|---|---|---|---|---|---|---|---|---|---|---|---|
| Period | Jul | Aug | Sep | Oct | Nov | Dec | Jan | Feb | Mar | Apr | May | Jun | Winter | Spring | Summer | Autumn | All | ||
| All years | |||||||||||||||||||
| All | 0.2 | 1.5 | 4.5 | 6.0 | 5.7 | 4.0 | 3.2 | 1.6 | 0.4 | 0.2 | 0.0 | 0.1 | 0.5 | 5.5 | 3.0 | 0.2 | 2.5 | ||
| Previous years | |||||||||||||||||||
| All previous years | 0.2 | 1.8 | 5.1 | 6.7 | 6.4 | 4.3 | 3.4 | 1.7 | 0.4 | 0.2 | 0.0 | 0.1 | 0.6 | 6.1 | 3.3 | 0.2 | 2.8 | ||
| Previous 30 years | 0.2 | 1.8 | 5.0 | 6.6 | 6.2 | 4.3 | 3.4 | 1.7 | 0.4 | 0.1 | 0.0 | 0.1 | 0.6 | 6.0 | 3.2 | 0.2 | 2.8 | ||
| Previous 20 years | 0.1 | 1.2 | 4.6 | 6.1 | 5.3 | 3.6 | 2.9 | 1.3 | 0.3 | 0.1 | 0.0 | 0.0 | 0.4 | 5.4 | 2.7 | 0.2 | 2.4 | ||
| 10 year groups | |||||||||||||||||||
| [2007,2017) | 0.0 | 1.0 | 4.4 | 6.1 | 5.5 | 3.6 | 3.0 | 1.3 | 0.3 | 0.1 | 0.1 | 0.0 | 0.3 | 5.4 | 2.7 | 0.2 | 2.5 | ||
| [1997,2007) | 0.1 | 1.7 | 5.2 | 6.2 | 4.8 | 3.7 | 2.8 | 1.1 | 0.3 | 0.2 | 0.0 | 0.0 | 0.5 | 5.4 | 2.8 | 0.2 | 2.4 | ||
| [1987,1997) | 0.7 | 3.3 | 7.1 | 9.8 | 9.2 | 8.1 | 5.9 | 3.7 | 1.1 | 0.2 | 0.0 | 0.6 | 1.6 | 8.8 | 6.0 | 0.5 | 4.5 | ||
| 5 year groups | |||||||||||||||||||
| [2012,2017) | 0.0 | 0.0 | 2.6 | 5.0 | 5.1 | 3.6 | 2.9 | 1.2 | 0.3 | 0.1 | 0.1 | 0.0 | 0.0 | 4.3 | 2.6 | 0.2 | 2.0 | ||
| [2007,2012) | 0.2 | 4.7 | 8.3 | 7.8 | 6.6 | 3.5 | 3.5 | 2.2 | 0.2 | 0.1 | 0.0 | 0.0 | 1.1 | 7.7 | 3.2 | 0.1 | 3.6 | ||
| [2002,2007) | 0.1 | 1.0 | 3.3 | 5.7 | 4.4 | 3.6 | 2.3 | 0.6 | 0.3 | 0.1 | 0.0 | 0.0 | 0.3 | 4.5 | 2.5 | 0.2 | 2.0 | ||
| [1997,2002) | 0.0 | 2.7 | 7.4 | 6.8 | 5.3 | 3.9 | 3.3 | 1.7 | 0.2 | 0.3 | 0.0 | 0.0 | 0.8 | 6.6 | 3.1 | 0.2 | 2.9 | ||
| [1992,1997) | 0.0 | 2.5 | 4.8 | 5.3 | 5.3 | 3.5 | 2.8 | 2.2 | 0.2 | 0.2 | 0.0 | 0.3 | 1.0 | 5.1 | 2.9 | 0.2 | 2.4 | ||
| [1987,1992) | 1.0 | 3.8 | 8.2 | 12.3 | 11.1 | 10.1 | 7.6 | 4.2 | 1.6 | 0.3 | 0.0 | 0.9 | 1.9 | 10.7 | 7.4 | 0.6 | 5.5 | ||
| Year | |||||||||||||||||||
| 2017 | 0.0 | 0.1 | 0.6 | 1.3 | 1.5 | 2.0 | 1.9 | 1.1 | 0.1 | 0.2 | 0.0 | 0.0 | 0.0 | 1.2 | 1.7 | 0.1 | 0.8 | ||
| 2016 | 0.0 | 0.0 | 2.6 | 7.8 | 6.2 | 4.5 | 2.8 | 1.0 | 0.3 | 0.0 | 0.1 | 0.0 | 0.0 | 5.7 | 2.6 | 0.2 | 2.3 | ||
| 2015 | 0.0 | 0.0 | 3.9 | 4.0 | 5.0 | 4.1 | 4.9 | 2.1 | 0.3 | 0.4 | 0.0 | 0.0 | 0.0 | 4.3 | 3.8 | 0.2 | 2.3 | ||
| 2014 | 0.0 | 0.0 | 1.3 | 2.7 | 4.4 | 2.5 | 1.7 | 0.5 | 0.2 | 0.0 | 0.0 | 0.0 | 0.0 | 2.6 | 1.5 | 0.1 | 1.2 | ||
| 2013 | 0.0 | 0.0 | 2.4 | 5.4 | 2.8 | 1.4 | 2.8 | 0.6 | 0.2 | 0.0 | 0.0 | 0.0 | 0.0 | 3.8 | 1.7 | 0.1 | 1.7 | ||
| 2012 | 0.0 | 0.0 | 2.0 | 3.3 | 5.7 | 4.9 | 1.1 | 1.0 | 0.6 | 0.0 | 0.5 | 0.0 | 0.0 | 3.5 | 2.3 | 0.3 | 1.9 | ||
| 2011 | 0.0 | 1.6 | 3.9 | 2.4 | 3.6 | 3.0 | 3.0 | 1.8 | 0.0 | 0.3 | 0.0 | 0.0 | 0.3 | 3.1 | 2.7 | 0.1 | 1.7 | ||
| 2010 | 0.0 | 9.6 | 12.4 | 12.4 | 8.1 | 1.5 | 2.4 | 1.2 | 0.0 | 0.0 | 0.0 | 0.0 | 2.3 | 11.5 | 1.8 | 0.0 | 5.0 | ||
| 2009 | 0.0 | 3.1 | 5.6 | 9.0 | 5.8 | 4.2 | 2.7 | 3.3 | 0.5 | 0.0 | 0.0 | 0.0 | 0.7 | 7.5 | 3.5 | 0.2 | 3.8 | ||
| 2008 | 0.7 | 7.0 | 16.5 | 8.6 | 10.7 | 8.6 | 13.5 | 4.6 | 0.5 | 0.0 | 0.0 | 0.0 | 1.9 | 11.0 | 9.0 | 0.2 | 6.3 | ||
| 2007 | 0.0 | 1.9 | 2.5 | 6.6 | 4.7 | 1.7 | 0.8 | 0.0 | 0.0 | 0.0 | 0.0 | 0.0 | 0.4 | 5.1 | 1.0 | 0.0 | 2.0 | ||
| 2006 | 0.0 | 0.0 | 3.5 | 6.1 | 4.8 | 7.3 | 2.8 | 0.7 | 0.3 | 0.0 | 0.0 | 0.0 | 0.0 | 5.1 | 3.9 | 0.2 | 2.4 | ||
| 2005 | 0.0 | 0.9 | 2.6 | 6.6 | 5.5 | 3.6 | 5.0 | 3.3 | 0.4 | 0.5 | 0.0 | 0.0 | 0.2 | 4.5 | 3.9 | 0.3 | 2.2 | ||
| 2004 | 0.4 | 0.0 | 0.5 | 0.6 | 0.6 | 1.4 | 0.0 | 0.0 | 0.0 | 0.0 | 0.0 | 0.0 | 0.2 | 0.5 | 0.6 | 0.0 | 0.3 | ||
| 2003 | 0.0 | 2.9 | 3.4 | 6.7 | 5.0 | 1.7 | 1.5 | 0.0 | 0.0 | 0.0 | 0.0 | 0.0 | 1.0 | 4.9 | 1.1 | 0.0 | 1.9 | ||
| 2002 | 0.0 | 0.8 | 7.0 | 7.3 | 6.0 | 4.4 | 2.5 | 0.0 | 0.9 | 0.0 | 0.0 | 0.0 | 0.2 | 6.8 | 2.9 | 0.4 | 2.9 | ||
| 2001 | 0.0 | 3.0 | 6.2 | 8.8 | 9.7 | 8.3 | 3.5 | 1.5 | 0.6 | 0.5 | 0.0 | 0.0 | 0.8 | 7.9 | 4.9 | 0.4 | 3.7 | ||
| 2000 | 0.0 | 4.6 | 9.8 | 10.1 | 6.9 | 3.3 | 4.5 | 2.9 | 0.0 | 0.4 | 0.0 | 0.0 | 1.5 | 9.0 | 3.6 | 0.2 | 3.8 | ||
| 1999 | 0.0 | 2.1 | 6.9 | 3.8 | 1.9 | 1.2 | 2.9 | 0.7 | 0.0 | 0.0 | 0.0 | 0.0 | 0.6 | 4.3 | 1.6 | 0.0 | 1.6 | ||
| 1998 | 0.0 | 0.0 | 8.9 | 2.2 | 3.5 | 0.9 | 1.5 | 0.0 | 0.0 | 0.0 | 0.0 | 0.0 | 0.0 | 5.2 | 0.9 | 0.0 | 2.2 | ||
| 1997 | 0.0 | 0.0 | 5.5 | 2.6 | 1.7 | 1.0 | 0.0 | 1.8 | 0.0 | 0.0 | 0.0 | 0.0 | 0.0 | 3.3 | 0.9 | 0.0 | 1.3 | ||
| 1996 | 0.0 | 2.1 | 12.0 | 6.1 | 2.8 | 2.0 | 2.9 | 1.2 | 0.0 | 0.0 | 0.0 | 0.0 | 0.8 | 6.4 | 2.1 | 0.0 | 2.6 | ||
| 1995 | 0.0 | 2.3 | 1.0 | 4.9 | 1.8 | 1.1 | 1.8 | 4.8 | 0.0 | 0.0 | 0.0 | 0.0 | 0.9 | 2.9 | 2.3 | 0.0 | 1.6 | ||
| 1994 | 0.0 | 3.9 | 2.9 | 7.0 | 3.7 | 2.2 | 4.4 | 1.7 | 0.0 | 0.8 | 0.0 | 0.0 | 1.4 | 4.5 | 2.9 | 0.3 | 2.2 | ||
| 1993 | 0.0 | 1.3 | 1.6 | 1.3 | 13.6 | 6.5 | 4.1 | 3.1 | 1.2 | 0.0 | 0.0 | 1.4 | 1.0 | 5.4 | 4.7 | 0.5 | 2.7 | ||
| 1992 | 0.0 | 3.7 | 7.1 | 6.4 | 9.7 | 7.9 | 1.7 | 0.0 | 0.0 | 0.0 | 0.0 | 0.0 | 1.1 | 7.6 | 3.7 | 0.0 | 3.4 | ||
| 1991 | 0.0 | 0.0 | 2.3 | 6.8 | 3.1 | 5.4 | 1.8 | 4.0 | 0.0 | 0.0 | 0.0 | 0.0 | 0.0 | 4.2 | 3.9 | 0.0 | 2.1 | ||
| 1990 | 1.9 | 1.6 | 5.4 | 9.2 | 9.3 | 9.7 | 12.5 | 1.4 | 0.0 | 0.0 | 0.0 | 0.0 | 1.4 | 8.1 | 7.9 | 0.0 | 4.0 | ||
| 1989 | 1.5 | 7.8 | 12.7 | 20.8 | 17.2 | 17.8 | 12.2 | 7.2 | 1.7 | 0.5 | 0.0 | 3.6 | 4.5 | 17.0 | 12.7 | 0.8 | 9.3 | ||
| 1988 | 0.4 | 3.4 | 11.2 | 13.3 | 13.5 | 8.7 | 8.5 | 5.1 | 2.0 | 0.5 | 0.0 | 0.0 | 1.4 | 12.9 | 7.6 | 0.9 | 5.8 | ||
| 1987 | 0.0 | 0.0 | 4.9 | 6.2 | 8.4 | 4.7 | 2.1 | 2.1 | 2.4 | 0.0 | 0.0 | 0.0 | 0.0 | 6.7 | 2.9 | 0.7 | 3.3 | ||
| 1986 | 0.0 | 0.0 | 13.2 | 25.0 | 25.5 | 11.8 | 4.3 | 5.6 | 0.0 | 3.9 | 0.0 | 0.0 | 0.0 | 20.6 | 7.5 | 1.8 | 8.4 | ||
| 1985 | 0.0 | 0.0 | 0.0 | 2.3 | 5.3 | 1.7 | 0.0 | 0.0 | 0.0 | 0.0 | 0.0 | 0.0 | 0.0 | 2.6 | 1.2 | 0.0 | 1.5 | ||
| 1984 | 0.0 | 0.0 | 0.0 | 0.0 | 0.0 | 0.0 | 10.3 | 6.1 | 0.0 | 0.0 | 0.0 | 0.0 | 0.0 | 0.0 | 6.8 | 0.0 | 2.1 | ||
| 1983 | 0.0 | 8.3 | 0.0 | 7.7 | 44.4 | 0.0 | 0.0 | 0.0 | 0.0 | - | 0.0 | 0.0 | 3.4 | 18.5 | 0.0 | 0.0 | 6.0 | ||
| 1982 | - | 0.0 | - | 0.0 | 0.0 | 0.0 | - | 0.0 | - | 0.0 | - | 0.0 | 0.0 | 0.0 | 0.0 | 0.0 | 0.0 | ||
Breeding data
Breeding records by month
Number of breeding records by breeding code and month, 2017 and all years| Breeding code | Jul | Aug | Sep | Oct | Nov | Dec | Jan | Feb | Mar | Apr | May | Jun |
|---|---|---|---|---|---|---|---|---|---|---|---|---|
| 2017 | ||||||||||||
| Breeding (BLA code) | 0 | 0 | 0 | 0 | 0 | 0 | 0 | 0 | 0 | 0 | 0 | 0 |
| Carrying Food | 0 | 0 | 0 | 0 | 0 | 0 | 0 | 0 | 0 | 0 | 0 | 0 |
| Copulating | 0 | 0 | 0 | 0 | 0 | 0 | 0 | 0 | 0 | 0 | 0 | 0 |
| Display | 0 | 0 | 0 | 1 | 0 | 0 | 0 | 0 | 0 | 0 | 0 | 0 |
| Dependent young | 0 | 0 | 0 | 0 | 0 | 0 | 0 | 0 | 0 | 0 | 0 | 0 |
| Faecal sac | 0 | 0 | 0 | 0 | 0 | 0 | 0 | 0 | 0 | 0 | 0 | 0 |
| Inspecting hollow | 0 | 0 | 0 | 0 | 0 | 0 | 0 | 0 | 0 | 0 | 0 | 0 |
| Nest building | 0 | 0 | 0 | 0 | 0 | 0 | 0 | 0 | 0 | 0 | 0 | 0 |
| Nest with eggs | 0 | 0 | 0 | 0 | 0 | 0 | 0 | 0 | 0 | 0 | 0 | 0 |
| Nest with young | 0 | 0 | 0 | 0 | 0 | 0 | 0 | 0 | 0 | 0 | 0 | 0 |
| On/leaving nest | 0 | 0 | 0 | 0 | 0 | 0 | 0 | 0 | 0 | 0 | 0 | 0 |
| All years | ||||||||||||
| Breeding (BLA code) | 0 | 0 | 0 | 0 | 1 | 0 | 1 | 0 | 0 | 0 | 0 | 0 |
| Carrying Food | 0 | 0 | 0 | 0 | 0 | 0 | 0 | 0 | 0 | 0 | 0 | 0 |
| Copulating | 0 | 0 | 0 | 2 | 0 | 0 | 0 | 0 | 0 | 0 | 0 | 0 |
| Display | 0 | 0 | 2 | 2 | 0 | 0 | 0 | 0 | 0 | 0 | 0 | 0 |
| Dependent young | 0 | 0 | 0 | 3 | 3 | 7 | 6 | 3 | 0 | 0 | 0 | 0 |
| Faecal sac | 0 | 0 | 0 | 0 | 0 | 0 | 0 | 0 | 0 | 0 | 0 | 0 |
| Inspecting hollow | 0 | 0 | 0 | 0 | 0 | 0 | 0 | 0 | 0 | 0 | 0 | 0 |
| Nest building | 0 | 0 | 0 | 0 | 0 | 0 | 0 | 0 | 0 | 0 | 0 | 0 |
| Nest with eggs | 0 | 0 | 0 | 0 | 0 | 0 | 0 | 0 | 0 | 0 | 0 | 0 |
| Nest with young | 0 | 0 | 0 | 0 | 0 | 0 | 0 | 0 | 0 | 0 | 0 | 0 |
| On/leaving nest | 0 | 0 | 0 | 0 | 0 | 0 | 0 | 0 | 0 | 0 | 0 | 0 |
Breeding records by year
Average number of breeding records per period by breeding code| Period | Breeding (BLA code) | Carrying Food | Copulating | Display | Dependent young | Faecal sac | Inspecting hollow | Nest building | Nest with eggs | Nest with young | On/leaving nest |
|---|---|---|---|---|---|---|---|---|---|---|---|
| All years | |||||||||||
| All | 0.1 | 0.0 | 0.1 | 0.1 | 0.6 | 0.0 | 0.0 | 0.0 | 0.0 | 0.0 | 0.0 |
| Previous years | |||||||||||
| All previous years | 0.1 | 0.0 | 0.1 | 0.1 | 0.6 | 0.0 | 0.0 | 0.0 | 0.0 | 0.0 | 0.0 |
| Previous 30 years | 0.1 | 0.0 | 0.1 | 0.1 | 0.7 | 0.0 | 0.0 | 0.0 | 0.0 | 0.0 | 0.0 |
| Previous 20 years | 0.1 | 0.0 | 0.1 | 0.1 | 0.8 | 0.0 | 0.0 | 0.0 | 0.0 | 0.0 | 0.0 |
| 10 year groups | |||||||||||
| [2007,2017) | 0.1 | 0.0 | 0.2 | 0.3 | 0.9 | 0.0 | 0.0 | 0.0 | 0.0 | 0.0 | 0.0 |
| [1997,2007) | 0.1 | 0.0 | 0.0 | 0.0 | 0.7 | 0.0 | 0.0 | 0.0 | 0.0 | 0.0 | 0.0 |
| [1987,1997) | 0.0 | 0.0 | 0.0 | 0.0 | 0.5 | 0.0 | 0.0 | 0.0 | 0.0 | 0.0 | 0.0 |
| 5 year groups | |||||||||||
| [2012,2017) | 0.2 | 0.0 | 0.0 | 0.2 | 0.8 | 0.0 | 0.0 | 0.0 | 0.0 | 0.0 | 0.0 |
| [2007,2012) | 0.0 | 0.0 | 0.4 | 0.4 | 1.0 | 0.0 | 0.0 | 0.0 | 0.0 | 0.0 | 0.0 |
| [2002,2007) | 0.2 | 0.0 | 0.0 | 0.0 | 0.2 | 0.0 | 0.0 | 0.0 | 0.0 | 0.0 | 0.0 |
| [1997,2002) | 0.0 | 0.0 | 0.0 | 0.0 | 1.2 | 0.0 | 0.0 | 0.0 | 0.0 | 0.0 | 0.0 |
| [1992,1997) | 0.0 | 0.0 | 0.0 | 0.0 | 0.2 | 0.0 | 0.0 | 0.0 | 0.0 | 0.0 | 0.0 |
| [1987,1992) | 0.0 | 0.0 | 0.0 | 0.0 | 0.8 | 0.0 | 0.0 | 0.0 | 0.0 | 0.0 | 0.0 |
| Year | |||||||||||
| 2017 | 0.0 | 0.0 | 0.0 | 1.0 | 0.0 | 0.0 | 0.0 | 0.0 | 0.0 | 0.0 | 0.0 |
| 2016 | 0.0 | 0.0 | 0.0 | 1.0 | 2.0 | 0.0 | 0.0 | 0.0 | 0.0 | 0.0 | 0.0 |
| 2015 | 0.0 | 0.0 | 0.0 | 0.0 | 0.0 | 0.0 | 0.0 | 0.0 | 0.0 | 0.0 | 0.0 |
| 2014 | 0.0 | 0.0 | 0.0 | 0.0 | 0.0 | 0.0 | 0.0 | 0.0 | 0.0 | 0.0 | 0.0 |
| 2013 | 1.0 | 0.0 | 0.0 | 0.0 | 0.0 | 0.0 | 0.0 | 0.0 | 0.0 | 0.0 | 0.0 |
| 2012 | 0.0 | 0.0 | 0.0 | 0.0 | 2.0 | 0.0 | 0.0 | 0.0 | 0.0 | 0.0 | 0.0 |
| 2011 | 0.0 | 0.0 | 0.0 | 1.0 | 0.0 | 0.0 | 0.0 | 0.0 | 0.0 | 0.0 | 0.0 |
| 2010 | 0.0 | 0.0 | 0.0 | 0.0 | 2.0 | 0.0 | 0.0 | 0.0 | 0.0 | 0.0 | 0.0 |
| 2009 | 0.0 | 0.0 | 1.0 | 1.0 | 1.0 | 0.0 | 0.0 | 0.0 | 0.0 | 0.0 | 0.0 |
| 2008 | 0.0 | 0.0 | 0.0 | 0.0 | 1.0 | 0.0 | 0.0 | 0.0 | 0.0 | 0.0 | 0.0 |
| 2007 | 0.0 | 0.0 | 1.0 | 0.0 | 1.0 | 0.0 | 0.0 | 0.0 | 0.0 | 0.0 | 0.0 |
| 2006 | 0.0 | 0.0 | 0.0 | 0.0 | 0.0 | 0.0 | 0.0 | 0.0 | 0.0 | 0.0 | 0.0 |
| 2005 | 0.0 | 0.0 | 0.0 | 0.0 | 0.0 | 0.0 | 0.0 | 0.0 | 0.0 | 0.0 | 0.0 |
| 2004 | 0.0 | 0.0 | 0.0 | 0.0 | 0.0 | 0.0 | 0.0 | 0.0 | 0.0 | 0.0 | 0.0 |
| 2003 | 0.0 | 0.0 | 0.0 | 0.0 | 0.0 | 0.0 | 0.0 | 0.0 | 0.0 | 0.0 | 0.0 |
| 2002 | 1.0 | 0.0 | 0.0 | 0.0 | 1.0 | 0.0 | 0.0 | 0.0 | 0.0 | 0.0 | 0.0 |
| 2001 | 0.0 | 0.0 | 0.0 | 0.0 | 3.0 | 0.0 | 0.0 | 0.0 | 0.0 | 0.0 | 0.0 |
| 2000 | 0.0 | 0.0 | 0.0 | 0.0 | 1.0 | 0.0 | 0.0 | 0.0 | 0.0 | 0.0 | 0.0 |
| 1999 | 0.0 | 0.0 | 0.0 | 0.0 | 1.0 | 0.0 | 0.0 | 0.0 | 0.0 | 0.0 | 0.0 |
| 1998 | 0.0 | 0.0 | 0.0 | 0.0 | 1.0 | 0.0 | 0.0 | 0.0 | 0.0 | 0.0 | 0.0 |
| 1997 | 0.0 | 0.0 | 0.0 | 0.0 | 0.0 | 0.0 | 0.0 | 0.0 | 0.0 | 0.0 | 0.0 |
| 1996 | 0.0 | 0.0 | 0.0 | 0.0 | 0.0 | 0.0 | 0.0 | 0.0 | 0.0 | 0.0 | 0.0 |
| 1995 | 0.0 | 0.0 | 0.0 | 0.0 | 1.0 | 0.0 | 0.0 | 0.0 | 0.0 | 0.0 | 0.0 |
| 1994 | 0.0 | 0.0 | 0.0 | 0.0 | 0.0 | 0.0 | 0.0 | 0.0 | 0.0 | 0.0 | 0.0 |
| 1993 | 0.0 | 0.0 | 0.0 | 0.0 | 0.0 | 0.0 | 0.0 | 0.0 | 0.0 | 0.0 | 0.0 |
| 1992 | 0.0 | 0.0 | 0.0 | 0.0 | 0.0 | 0.0 | 0.0 | 0.0 | 0.0 | 0.0 | 0.0 |
| 1991 | 0.0 | 0.0 | 0.0 | 0.0 | 1.0 | 0.0 | 0.0 | 0.0 | 0.0 | 0.0 | 0.0 |
| 1990 | 0.0 | 0.0 | 0.0 | 0.0 | 0.0 | 0.0 | 0.0 | 0.0 | 0.0 | 0.0 | 0.0 |
| 1989 | 0.0 | 0.0 | 0.0 | 0.0 | 2.0 | 0.0 | 0.0 | 0.0 | 0.0 | 0.0 | 0.0 |
| 1988 | 0.0 | 0.0 | 0.0 | 0.0 | 1.0 | 0.0 | 0.0 | 0.0 | 0.0 | 0.0 | 0.0 |
| 1987 | 0.0 | 0.0 | 0.0 | 0.0 | 0.0 | 0.0 | 0.0 | 0.0 | 0.0 | 0.0 | 0.0 |
| 1986 | 0.0 | 0.0 | 0.0 | 0.0 | 0.0 | 0.0 | 0.0 | 0.0 | 0.0 | 0.0 | 0.0 |
| 1985 | 0.0 | 0.0 | 0.0 | 0.0 | 1.0 | 0.0 | 0.0 | 0.0 | 0.0 | 0.0 | 0.0 |
| 1984 | 0.0 | 0.0 | 0.0 | 0.0 | 0.0 | 0.0 | 0.0 | 0.0 | 0.0 | 0.0 | 0.0 |
| 1983 | 0.0 | 0.0 | 0.0 | 0.0 | 0.0 | 0.0 | 0.0 | 0.0 | 0.0 | 0.0 | 0.0 |
| 1982 | 0.0 | 0.0 | 0.0 | 0.0 | 0.0 | 0.0 | 0.0 | 0.0 | 0.0 | 0.0 | 0.0 |
Distribution map
Distribution - 2017
This map shows the observed distribution of the Horsfield’s Bronze-Cuckoo for 2017.
The red circles are the grid cells where Horsfield’s Bronze-Cuckoo have been reported.
The transparency of the red circles indicate how many surveys sheets were submitted for that grid cell; the darker the red the more reliable the data. Of the 315 grid cells with reports, 83 had only one sheet; an example is grid number W12.
The size of the circle represents the reporting rate. The maximum reporting rate for Horsfield’s Bronze-Cuckoo was 100.0% (eg grid number W12) and the minimum was 0.1% (eg grid number J14). 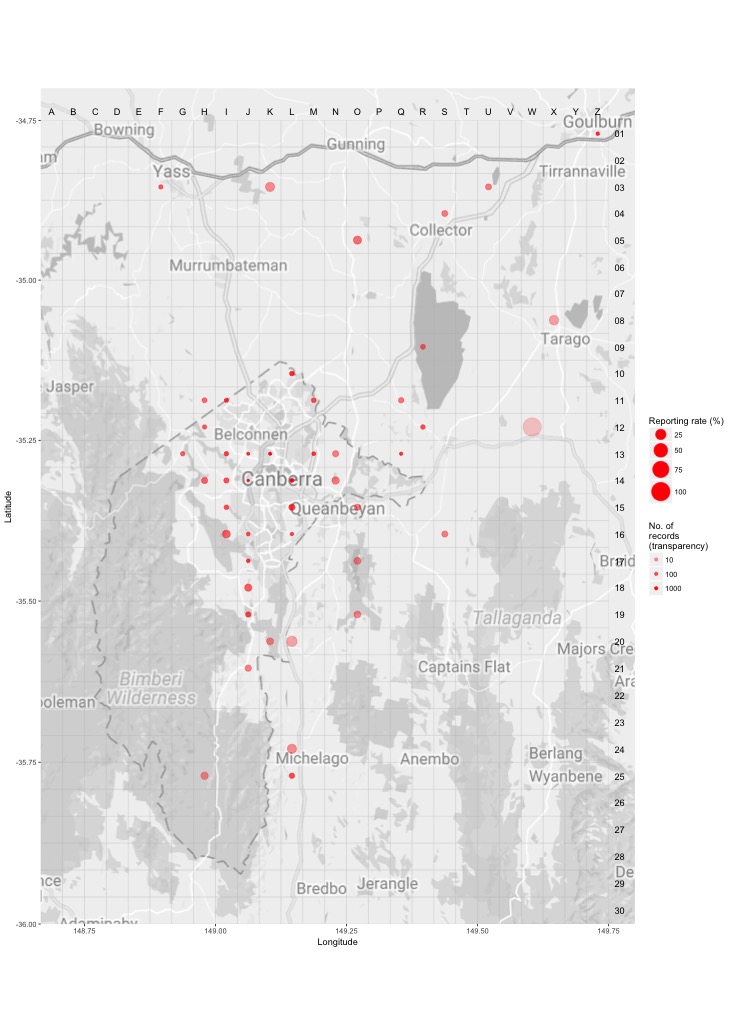
Distribution - all years
This map shows the observed distribution of the Horsfield’s Bronze-Cuckoo for all years.
The red circles are the grid cells where Horsfield’s Bronze-Cuckoo have been reported.
The transparency of the red circles indicate how many surveys sheets were submitted for that grid cell; the darker the red the more reliable the data. Of the 703 grid cells with reports, 55 had only one sheet; an example is grid number X15.
The size of the circle represents the reporting rate. The maximum reporting rate for Horsfield’s Bronze-Cuckoo was 100.0% (eg grid number X15) and the minimum was 0.1% (eg grid number S13). 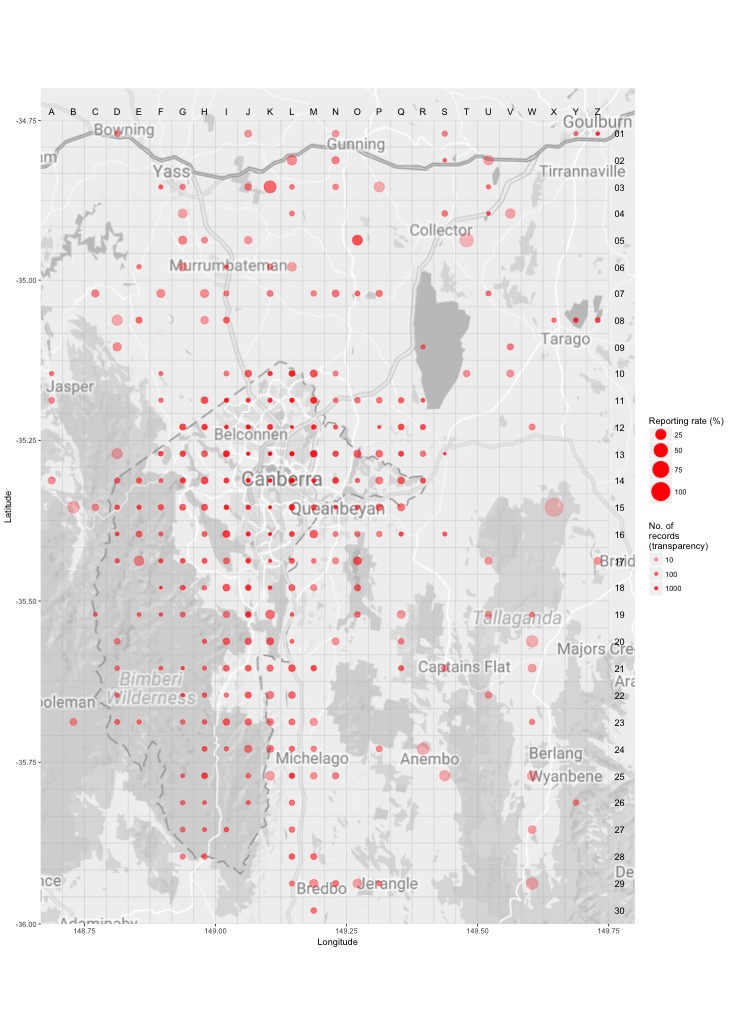
Breeding map
Breeding - 2017
This map shows the breeding distribution of the Horsfield’s Bronze-Cuckoo for 2017.
The red circles are the grid cells where breeding activity for Horsfield’s Bronze-Cuckoo have been reported.
The size of the circle represents the number of reports. 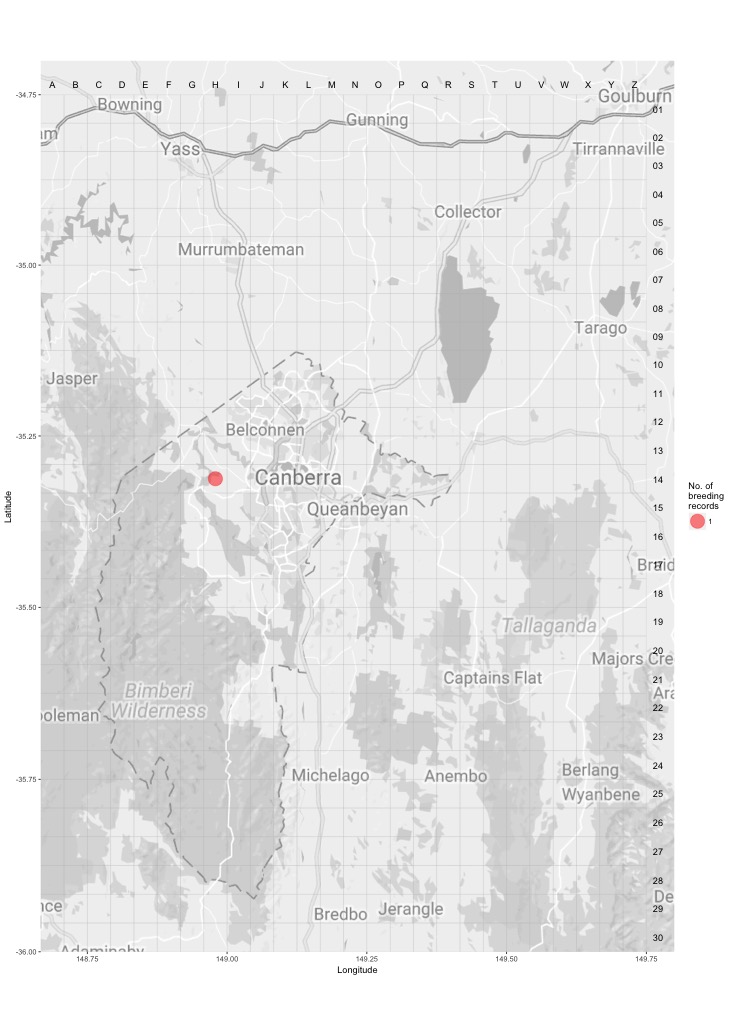
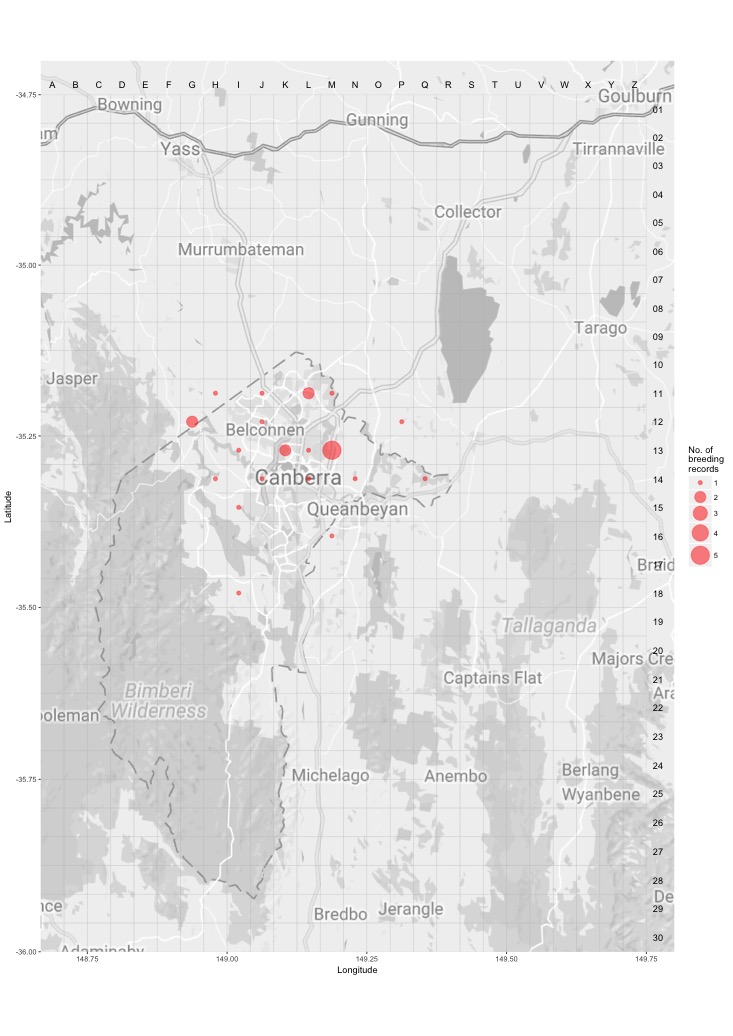
Breeding - all years
This map shows the breeding distribution of the Horsfield’s Bronze-Cuckoo for all years.
The red circles are the grid cells where breeding activity for Horsfield’s Bronze-Cuckoo have been reported.
The size of the circle represents the number of reports.